All information we need in one shot. This is what visualization offers in data analysis.
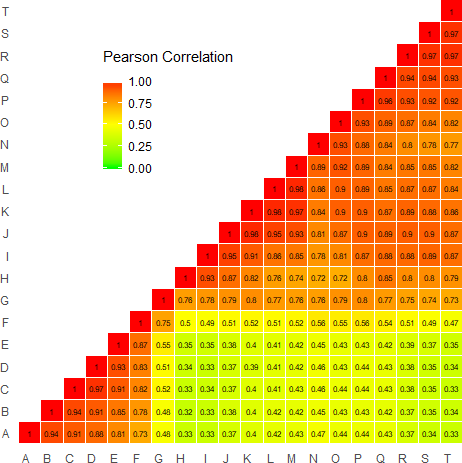
At this image we present a correlation matrix with and without correlation values for 20 variables. It’s easy to see patterns at this image - patterns of high and low correlation pairs, especially, if the image is properly colored. For example, at this correlation matrix we can spot that the group of variables A to F is low correlated with the group G to T.
However, we can find high correlated pairs only inside those groups, meaning that we know where to look for high or low correlation. Furthermore, we can add correlation values for each pair in order to have more precise results.

It is piece of cake to detect some patterns at these type of images, even with the naked eye. This job gets done even on pretty messy correlation matrices if we reorder the matrix splitting the image into multiple, colored regions.